A) there is a surplus of 400 units.
B) there is a surplus of 200 units.
C) there is a shortage of 200 units.
D) there is a shortage of 400 units.
E) supply exceeds demand.
G) A) and B)
Correct Answer

verified
Correct Answer
verified
Multiple Choice
If demand increases and supply decreases, then the
A) equilibrium price rises but the effect on the equilibrium quantity is unknown.
B) equilibrium quantity increases but the effect on the equilibrium price is unknown.
C) equilibrium price falls but the effect on the equilibrium quantity is unknown.
D) effect on both equilibrium price and quantity is unknown.
E) equilibrium quantity decreases but the effect on the equilibrium price is unknown.
G) B) and D)
Correct Answer

verified
Correct Answer
verified
Multiple Choice
If both demand and supply increase, then the equilibrium price
A) falls but the equilibrium quantity increases.
B) falls, and the equilibrium quantity could either increase or decrease.
C) could either rise or fall, but the equilibrium quantity increases.
D) and equilibrium quantity increases.
E) rises, and the equilibrium quantity could either increase or decrease.
G) B) and C)
Correct Answer

verified
Correct Answer
verified
Multiple Choice
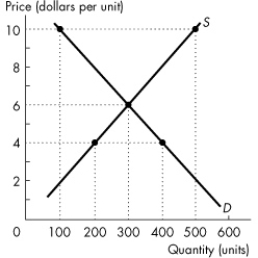
Use the figure below to answer the following questions.
 Figure 3.4.2
-Refer to Figure 3.4.2.When the price is $10 a unit,
A) consumers will buy nothing.
B) consumers will buy 500 units of output.
C) a shortage occurs.
D) the surplus is zero.
E) consumers will buy 100 units of output.
G) A) and C)
Correct Answer

verified
Correct Answer
verified
Multiple Choice
The cost of producing aspirin increases at the same time as doctors discover that taking one aspirin per day reduces the risk of heart attacks.As a result, the
A) supply of aspirin decreases and the demand for aspirin increases.
B) equilibrium quantity of aspirin decreases and the equilibrium price of aspirin rises.
C) equilibrium quantity of aspirin increases and the equilibrium price of aspirin rises.
D) supply of aspirin decreases by more than the demand for aspirin increases.
E) supply of aspirin increases and the demand for aspirin decreases.
G) None of the above
Correct Answer

verified
Correct Answer
verified
Multiple Choice
Which one of the following will shift the supply curve of good X leftward?
A) a situation where the quantity of X demanded exceeds the quantity of X supplied
B) a decrease in the cost of capital used to produce X
C) a decrease in the wages of workers employed to produce X
D) an increase in the cost of machinery used to produce X
E) a technological change that increases production of X
G) A) and D)
Correct Answer

verified
Correct Answer
verified
Multiple Choice
The demand curve slopes downward to the right because
A) an increase in income leads to increased consumption.
B) as income rises, the quantity demanded increases.
C) when expected future prices rise, the quantity demanded increases.
D) of the substitution effect and the income effect.
E) of comparative advantage.
G) C) and E)
Correct Answer

verified
Correct Answer
verified
Multiple Choice
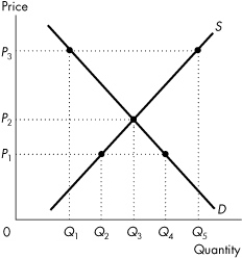
Use the figure below to answer the following questions.
 Figure 3.4.1
-At price P1 in Figure 3.4.1,
A) both sides of the market are able to carry out their desired transactions.
B) producers are unwilling to sell any goods.
C) producers can sell all they plan to sell.
D) consumers can buy all they want.
E) a surplus exists.
G) C) and E)
Correct Answer

verified
Correct Answer
verified
Multiple Choice
When the supply of good A decreases,
A) the equilibrium price will decrease, but the equilibrium quantity will increase.
B) the equilibrium price and the equilibrium quantity will increase.
C) the equilibrium price will increase, but the equilibrium quantity will decrease.
D) a surplus will result.
E) the equilibrium price and the equilibrium quantity will decrease.
G) C) and D)
Correct Answer

verified
Correct Answer
verified
Multiple Choice
The price of a good will fall if
A) demand for the good increases.
B) supply of the good remains constant.
C) supply of the good decreases.
D) supply of the good increases.
E) demand for the good remains constant.
G) A) and E)
Correct Answer

verified
Correct Answer
verified
Multiple Choice
Good A is a normal good if
A) good A satisfies the law of demand.
B) a rise in the price of a substitute causes the demand for A to increase.
C) income and the demand for A are negatively related.
D) the demand for A increases when income rises.
E) a rise in the price of a complement causes the demand for A to decrease.
G) All of the above
Correct Answer

verified
Correct Answer
verified
Multiple Choice
Bottled water and health club memberships are
A) complements in production.
B) inferior goods.
C) complements.
D) substitutes.
E) substitutes in production.
G) B) and E)
Correct Answer

verified
Correct Answer
verified
Multiple Choice
The price of good X falls and the demand for good Y decreases.We can conclude that
A) X is an inferior good.
B) X and Y are substitutes in production.
C) X and Y are complements.
D) X and Y are substitutes.
E) X is a normal good.
G) A) and B)
Correct Answer

verified
Correct Answer
verified
Multiple Choice
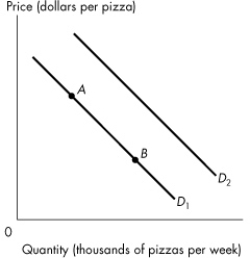
Use the figure below to answer the following questions.
 Figure 3.2.2
-Refer to Figure 3.2.2.If consumers' income increases,
A) the demand curve for pizzas shifts from D1 to D2 if a pizza is a normal good.
B) a movement from point A to point B on D1 occurs.
C) the quantity of pizzas demanded increases.
D) the quantity of pizzas supplied decreases.
E) the supply of pizzas increases.
G) C) and D)
Correct Answer

verified
Correct Answer
verified
Multiple Choice
Use the information below to answer the following questions. Fact 3.5.1 The market for coffee is initially in equilibrium.Pepsi is a substitute for coffee; cream is a complement of coffee.Consider the for coffee.Assume that all ceteris paribus assumptions continue to hold except for the event listed. -Refer to Fact 3.5.1.If there is an increase in the wages of farm workers who harvest coffee beans, the equilibrium quantity of coffee
A) increases.
B) decreases.
C) remains the same.
D) increases or decreases depending on the slope of the supply and demand curves.
E) increases or decreases depending on the relative shifts of the supply and demand curves.
G) B) and D)
Correct Answer

verified
Correct Answer
verified
Multiple Choice
The y- axis intercept of the demand curve is 60 and the slope is - 8.The equation of the demand curve is
A) P = 60 + 8QD.
B) P = 60 - 8QD.
C) P = 8 - 60QD.
D) QD = 60 - 8P.
E) QD = 60 + 8P.
G) A) and B)
Correct Answer

verified
Correct Answer
verified
Multiple Choice
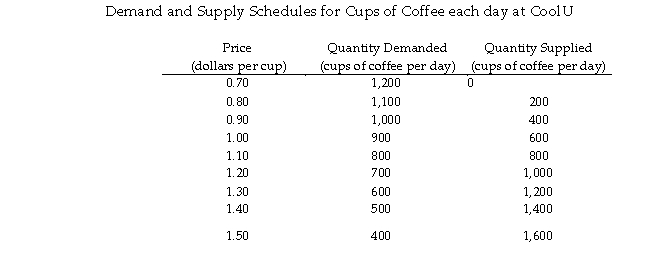
Use the figure below to answer the following questions.
Table 3.5.2  -Refer to Table 3.5.2.A premature frost destroys half the coffee trees.This change would be represented as a
A) movement down along the supply curve.
B) rightward shift of the supply curve.
C) leftward shift of the supply curve.
D) leftward shift of the demand curve.
E) rightward shift of the demand curve.
G) A) and C)
Correct Answer

verified
Correct Answer
verified
Multiple Choice
The fact that a fall in the price of a good results in a decrease in the quantity of the good supplied illustrates
A) the law of supply.
B) the nature of an inferior good.
C) the law of demand.
D) a change in supply.
E) technological improvement.
G) A) and D)
Correct Answer

verified
Correct Answer
verified
Multiple Choice
Use the table below to answer the following questions.
Table 3.1.1  -Refer to Table 3.1.1.In 2015, the relative price of coffee in terms of tea is
A) 1.00.
B) 2.10.
C) 1.07.
D) 2.25.
E) 0.93.
G) A) and D)
Correct Answer

verified
Correct Answer
verified
Multiple Choice
The demand curve is P = 800 - 25QD.The supply curve is P = 500 + 25QS.At market equilibrium, the equilibrium quantity is _______ and the equilibrium price is _______ .
A) 1,300; zero
B) 6.0; 650
C) 25; 0.17
D) 0.17; 25
E) 650; 6.0
G) A) and C)
Correct Answer

verified
Correct Answer
verified
Showing 21 - 40 of 185
Related Exams