A) The Pearson correlation coefficient
B) The Spearman rank-order correlation coefficient
C) The point-biserial correlation coefficient
D) The nonlinear correlation coefficient
F) A) and B)
Correct Answer

verified
Correct Answer
verified
Multiple Choice
Which of the following studies represents the weakest relationship? 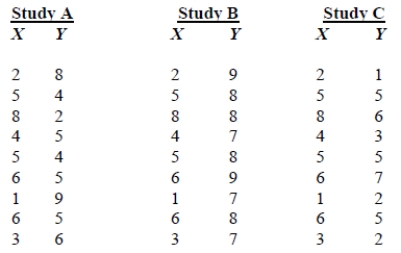
A) Study A
B) Study B
C) Study C
D) Cannot determine
F) B) and D)
Correct Answer

verified
Correct Answer
verified
Multiple Choice
Calculate the appropriate correlation coefficient for the following data. 
A) 0.07
B) +0.95
C) +0.49
D) +0.23
F) A) and D)
Correct Answer

verified
Correct Answer
verified
Multiple Choice
If you see the notation  ,what should you do?
A) First multiply each X by its partner Y,then sum the results.
B) First sum the Xs then multiply the sum of the Xs by each Y.
C) First sum the Ys,then multiply the sum of the Ys by each X.
D) First sum the Xs,then sum the Ys,then multiply the sums.
F) None of the above
Correct Answer

verified
Correct Answer
verified
Multiple Choice
If we compute a correlation on data that come only from the middle of the X distribution (restricted range) rather than from the entire range,the correlation is likely to be _____ the correlation from the entire range.
A) smaller than
B) the same as
C) a little larger than
D) a lot larger than
F) A) and B)
Correct Answer

verified
Correct Answer
verified
Multiple Choice
What kind of relationship is depicted in the following graph? 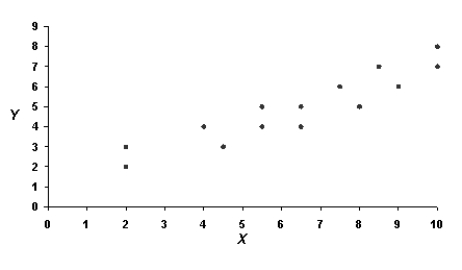
A) A positive linear correlation
B) A negative linear correlation
C) No correlation
D) A nonlinear correlation
F) A) and B)
Correct Answer

verified
Correct Answer
verified
Multiple Choice
What statistic should be used to find out whether there is a relationship between high school class rank and first-semester college GPA rank?
A) The Pearson correlation coefficient
B) The Spearman rank-order correlation coefficient
C) The point-biserial correlation coefficient
D) The nonlinear correlation coefficient
F) A) and B)
Correct Answer

verified
Correct Answer
verified
Multiple Choice
What statistic should be used to find out whether there is a relationship between hours spent participating in sports and GPA?
A) The Pearson correlation coefficient
B) The Spearman rank-order correlation coefficient
C) The point-biserial correlation coefficient
D) The nonlinear correlation coefficient
F) A) and C)
Correct Answer

verified
Correct Answer
verified
Multiple Choice
Which relationship is stronger,r = +0.62 or r = -0.62?
A) An r = +0.62 represents a stronger relationship than r = -0.62.
B) An r = -0.62 represents a stronger relationship than r = +0.62.
C) There is no difference in the strength of the two relationships.
D) Without seeing a scatterplot of the data,there is no way to determine which is stronger.
F) None of the above
Correct Answer

verified
Correct Answer
verified
Multiple Choice
When the correlation coefficient representing the relationship between X and Y is intermediate,then all of the following are true except
A) there is not a perfectly consistent association.
B) there are different Y scores associated with a single X score.
C) prediction of Y from a known X score has some error.
D) all data points fall on the regression line.
F) A) and B)
Correct Answer

verified
Correct Answer
verified
Multiple Choice
What kind of relationship is depicted in the following graph? 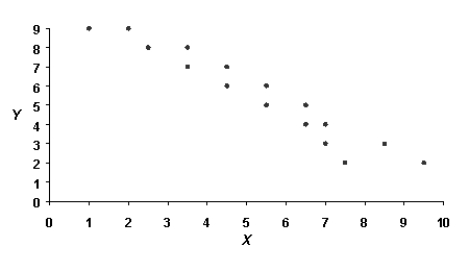
A) A positive linear correlation
B) A negative linear correlation
C) No correlation
D) A nonlinear correlation
F) A) and C)
Correct Answer

verified
Correct Answer
verified
Multiple Choice
In a study about the relationship between their age and women's attitudes about marriage,you survey over 500 undergraduate women and calculate a Pearson correlation coefficient.What mistake have you made?
A) You have collected too much data.
B) There is no way a woman's attitude about marriage can affect her age.
C) You only surveyed young women in college causing a restriction of range.
D) You have used the wrong correlation coefficient the type of data.
F) B) and C)
Correct Answer

verified
Correct Answer
verified
Multiple Choice
Calculate the appropriate correlation coefficient for the following data. 
A) -0.97
B) -0.39
C) +0.11
D) +0.57
F) B) and C)
Correct Answer

verified
Correct Answer
verified
Multiple Choice
Professor Miller has found that the correlation between a person's "need for affiliation" (found by taking a test to determine the need to be with others) and the number of hours spent watching television is 0.69.He should conclude that
A) as we observe people with higher and higher need for affiliation,we see a tendency for those people to spend less and less time watching television.
B) there is not much of a relationship between the two variables because the r is negative.
C) as we observe people with higher and higher need for affiliation,we see a tendency for those people to spend more and more time watching television.
D) the people who watch more television tend to have more need to be around others.
F) A) and B)
Correct Answer

verified
Correct Answer
verified
Multiple Choice
What kind of relationship is depicted in the following graph? 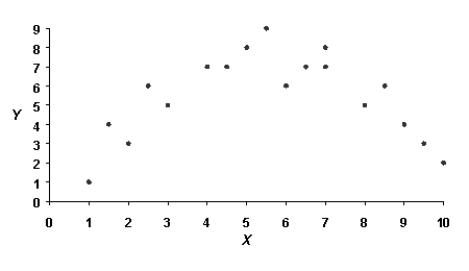
A) A positive linear correlation
B) A negative linear correlation
C) No correlation
D) A nonlinear correlation
F) B) and D)
Correct Answer

verified
Correct Answer
verified
Multiple Choice
What type of relationship does the following regression line represent? 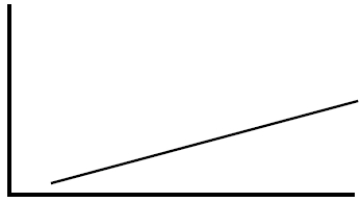
A) A positive relationship
B) A negative relationship
C) A curvilinear relationship
D) No relationship
F) A) and C)
Correct Answer

verified
Correct Answer
verified
Multiple Choice
Calculate the appropriate correlation coefficient for the following data 
A) -0.68
B) +0.72
C) -0.41
D) -0.93
F) B) and C)
Correct Answer

verified
Correct Answer
verified
Multiple Choice
What does a correlation coefficient do?
A) It allows us to draw conclusions about whether one variable causes another variable.
B) It creates a correlational design,rather than an experimental design.
C) It quantifies the pattern in a relationship.
D) It summarizes the X scores and the Y scores separately.
F) A) and D)
Correct Answer

verified
Correct Answer
verified
Multiple Choice
Suppose a researcher has trained two observers to rank participants according to their level of frustration when trying to solve a puzzle.What statistic should be used to determine the extent to which the two observers agree in their rankings of frustration?
A) The Pearson correlation coefficient
B) The Spearman rank-order correlation coefficient
C) The point-biserial correlation coefficient
D) The nonlinear correlation coefficient
F) B) and C)
Correct Answer

verified
Correct Answer
verified
Multiple Choice
"The self-confidence of a group of students is positively correlated with their chances of getting through the course." What does this statement mean?
A) The students will pass the course if they can be made to be self-confident.
B) The chances of passing the course tend to increase as the self-confidence scores of the students increase.
C) The chances of passing the course tend to decrease as the self-confidence scores of the students increase.
D) Passing the course will make the students self-confident.
F) A) and D)
Correct Answer

verified
Correct Answer
verified
Showing 21 - 40 of 52
Related Exams